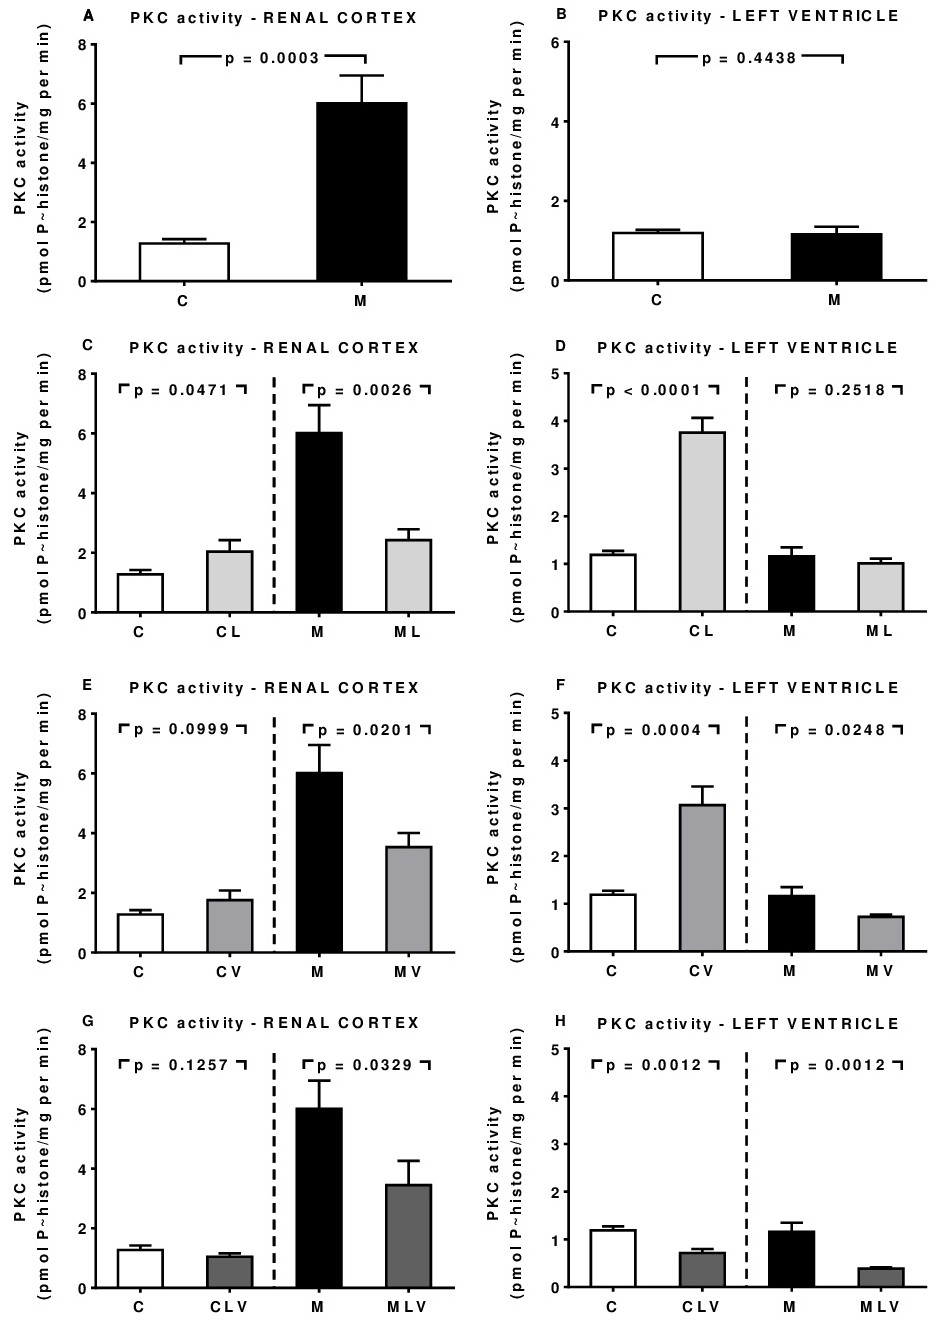
Fig. 2. Tissue-specific modifications of PKC induced by chronic malnutrition: different responses to Losartan and Valproate treatment in kidney and heart. Panels A and B show PKC activity in basolateral membranes from renal cortex corticis tubules and plasma membranes from left ventricle cardiomyocytes, respectively. Empty bars: normonourished rats (C); black bars: malnourished rats (M). In the rest of the panels, vertical dashed lines separate normonourished and malnourished groups in each organ; the left sections correspond to normonourished rats; the right sections correspond to malnourished rats. Abbreviations of the groups are indicated on the abscissae, according to the nutritional status and the timeline of pharmacological interventions with Losartan, Valproate or a combination of both drugs, as described in the text and in Supplementary Table 1. The data are mean ± SEM (n = 6). Differences were assessed by Student's t-test. The p values are indicated within the panels.